Australia’s market operator Q1 2026 report highlights 4.4 GW of grid storage coming online boosting renewables

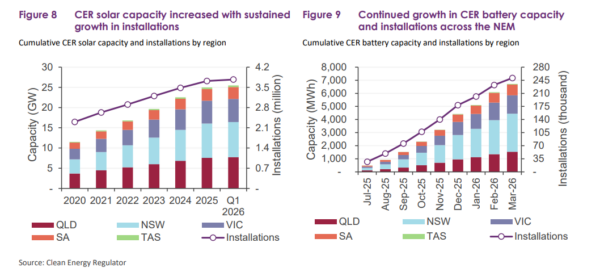
New data released by the Australian Energy Market Operator (AEMO) in its Quarterly Energy Dynamics (QED) Q1 2026 report suggests that as 4,445 MW / 11,219 MWh of large-scaled battery storage was added to the grid, it helped with record solar generation with average battery generation up more than 300%. The growth in the residential battery sector was also highlighted, with cumulative capacity reaching 6,716 MWh at the end of March 2026.
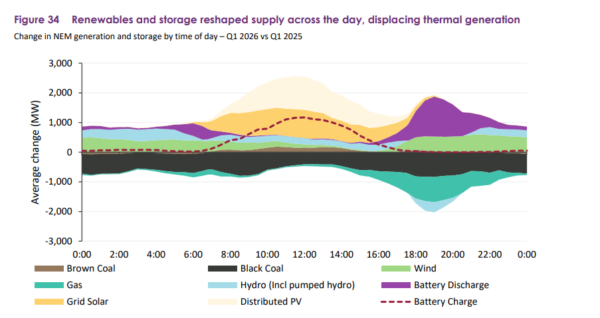
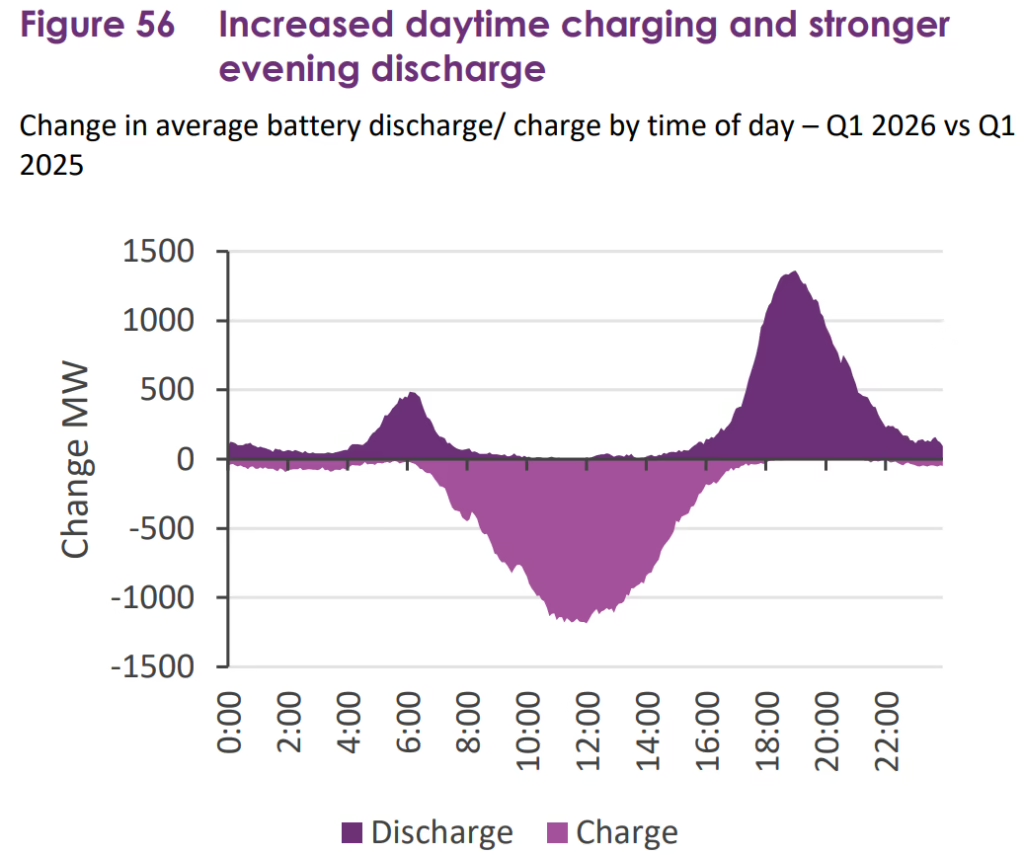
The AEMO report suggested average battery discharge reached 359 MW during the quarter, more than three times the 98MW recorded in the level in Q1 2025. The report highlighted the reshaping of supply patterns across the day.
Overall, renewables supplied 46.5% of generation, the highest share on record for a first quarter, peaking at 92.2% on 1 January, driven by increased solar and wind output, with the growing backbone of batteries helping to change intraday patterns and suppress the need for thermal generation.
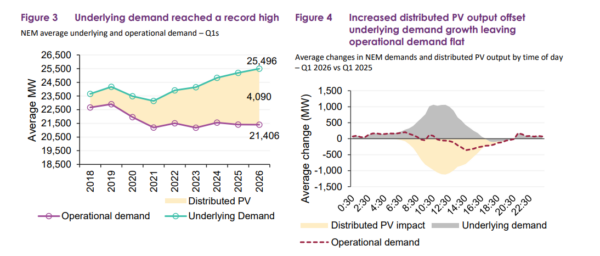
The quarter saw underlying electricity demand across the National Electricity Market (NEM) reach a record of 25,496 MW, up 1.2% on the same period in 2025, but distributed rooftop solar output offset the growth, broadly cancelling out operational demand.
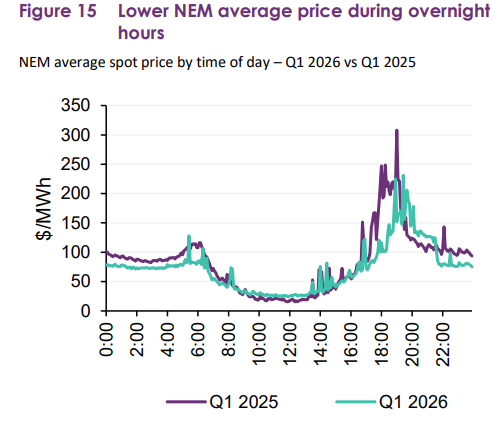
Developers and investors in grid-scale batteries should also note a key point in the report, that said “average spot prices increased slightly during the daytime hours, while prices overnight decreased compared to Q1 2025 (Figure 15). Increased battery charging activity and reduced negative price impact lifted daytime prices, while overnight prices decreased due to higher wind output displacing coal generation and more supply being effectively available to meet mainland demand.”
Consumer Energy Resources
The QED reports the introduction of the Australian government’s Cheaper Home Batteries Program supported a rapid increase in household battery uptake, with cumulative capacity reaching 6,716 MWh at the end of March 2026 and installations rising to 251,119.
By the end of Q1 2026, NSW had reached 2,911 MWh, Queensland reached 1,533 MWh, Victoria, 1,406 MWh, and SA and Tasmania reached 812 MWh and 54 MWh respectively.
AEMO Executive General Manager Policy and Corporate Affairs Violette Mouchaileh, said the quarter highlighted how energy storage and renewables are increasingly shaping electricity market outcomes.
“The significant increase in large‑scale and household battery capacity is changing how electricity is produced, consumed and priced across the day,” Mouchaileh said.
“Grid-scale batteries are increasingly absorbing excess renewable energy during the day and shifting it into the market during evening peaks, helping moderate prices during high-demand periods.”
Grid-scale solar
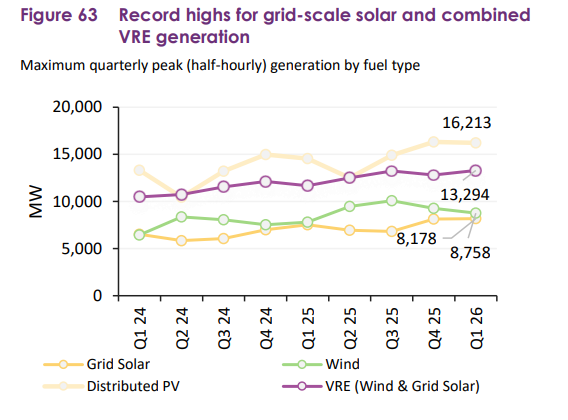
Grid-scale solar’s 13% output increase from Q1 2025, set a record rising to 2,706 MW, but on Tuesday, 6 January 2026, in the interval ending at 11.30am, grid-scale solar output topped 8,178 MW.
“This exceeded the previous peak of 8,148 MW, set in Q4 2025. Peak variable renewable energy (VRE) output, comprising wind and grid‑scale solar, also reached a new record this quarter, at 13,294 MW in the half‑hour ending at 9.30am on Friday, 9 January 2026. This was 63 MW (+0.5%) higher than the previous record set in Q3 2025,” the QED reports.
The report shows distributed solar output achieved a record 4,090 MW, up 308 MW (+8.1%) year on year, with NEM-wide operational demand averaging 21,406 MW in the quarter and distributed solar output largely offsetting that demand.
In Queensland, distributed solar output averaged 1,211 MW, up 118 MW (+11%), while in New South Wales (NSW), where underlying demand increased by up to 259 MW or 3%, to average 8,978 MW, thanks to weather conditions and data centre growth, distributed soalr output increased in Q1 by a record 1,338 MW, up 10% or 122 MW.
Victoria’s distributed solar output increased by a record 955 MW, up 48 MW (+5.3%), and in South Australia, a marginal record was set for distributed solar output, averaging 514 MW, up 11 MW, or by a 2.2% increase.
Tasmania also saw a distributed solar output record, averaging 71 MW, up 7 MW or 12%.
From pv magazine Australia.
Written by


Comments


")


